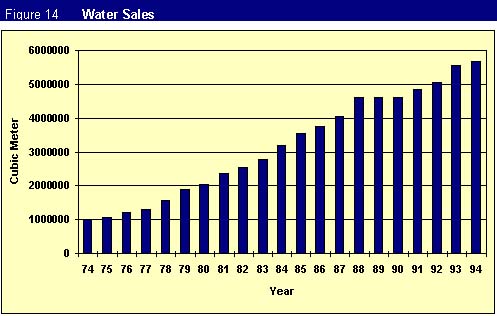
JWU has maintained this balance during the past 30 years, i.e. its regular revenue covers its regular expenses. Development and capital expenses are financed largely through grants from national and international sources.
In 1993, JWU started adapting a cost recovery policy, and in order to ensure that, detailed cost statements are prepared, and a cost study was conducted by JWU staff with cooperation from Institute Mediterranean DeL'au' ( IME ), the World Bank and the Principality of Monaco.
The Board of Directors of JWU decided in 1993 to adapt a policy of allocating 10% of all granted funds in a revolving fund for reinvestment retroactive since 1985. JWU is considering ways to invest this fund in the most secure, least risk and maximum return investment.
FINANCING SOURCES
JWU depends on three main sources to finance its projects:
1. Internal self financing using its own income and earnings to finance the daily work and the scheduled operations and maintenance.
2. A growing revolving fund for reinvestment. As of December 1994, the balance in this fund is $ 572,312.27.
3. External financing from contributions by national and international Development Agencies to finance capital projects that are beyond JWU financing means such as drilling wells, building reservoirs etc.
During the past 10 years, JWU utilized funds donated by the national and international development agencies such as the World Bank, UNDP, EEC, Arab Fund, the Islamic Development Bank, Community Development Fund (CDF), the German Government through GTZ, Palestinian Economic Council for Development and Reconstruction (PECDAR) and the Joint Palestinian Jordanian Committee to finance the drilling of 3 wells, rehabilitation main distribution lines through out JWU pipeline networks, to construct reservoirs and increase the conveyance capacity from own resources. The following "HONOR LIST" illustrates the kind, amount and funder that invested in JWU projects:
Table 17 List of International Funding for JWU Projects
| Project | Funded by | Amount Invested | Status of Project |
|---|---|---|---|
| Drilling new wells and rehabilitating others. Studies, Training and Providing Consultancy | The German Government through GTZ (1994-1995) | 4,578,000 DM | Partially completed. Three years agreement |
| Rehabilitation of Networks | USAID through UNDP (1994) | 1,800,000 USD | Some work still in progress |
| Construction of Reservoirs, Rehabilitation of Pumping Station and Laying Main Lines | Community Development Fund (CDF) (1985) | 1,400,000 USD | Completed |
| Equipping Well #4 and Main Line | UNDP (1993-1994) | 750,000 USD | Completed |
| Main Conveyance pipeline for Ramallah El-Bireh and BirZeit | Saudi Arabian government through PECDAR (`1995) | 1,300,000 USD | Still in Progress |
| Equipping Pumping Stations. Civil and Electrical works. | Arab Fund for Economic and Social Development (1992-1995) | 100,000 Kuwaiti Dinars | Still in Progress |
| Studies in the fields of water resources management, water saving and water cost | World Bank and the Principality of Monaco through IME (1994) | 30,000 USD | Studies were conducted. |
| Drilling Well # 4 | EEC (1990) | 570,000 ECU | Work Completed |
| Electrical Works | OPEC (1992-1995) | 250,000 USD | Work Completed |
| Drilling & Equipping Well # 3 and BeitHanina Line | Joint Palestinian Jordanian Committee (1980) | 1,500,000 USD | Completed |
| Civil and Mechanical Works in Pumping Stations | Islamic Development Bank -Jedda (1992-1995) | 420,000 USD | Still in Progress |
FINANCIAL RATIOS AND REVENUE ANALYSIS
To illustrate the financial position of the JWU, Table 18 shows selected financial ratios as calculated based on the financial statements of JWU 1994, compared to the respective ratios of selected water authorities in different cities. It indicates that the working ratio which shows the ratio between operation cost excluding depreciation and the operating revenues is relatively high compared to other water utilities in different cities, it is about 89% of operating revenues. To add the depreciation to the operating cost, the operation ratio excluding administration cost will increase to 107% of revenues. This ratio also is higher than the ratios of the selected three cities.
Table 18 Financial Ratios of JWU as in 1994 Compared with Ratios
of Selected Countries as shown in the TWUWS Report, 1993
| Financial Ratios | JWU | Compared To |
|---|---|---|
| Financial Working Ratio (operating cost - depreciation / operating revenue) | 0.89 | Ankara; 0.55,Manila; 0.45, Morocco; 0.6 |
| Operating Ratio (operating cost / operating revenue excluding administrative cost) | 1.07 | Ankara; 0.65, Manila; 0.5, Morocco; 0.6 |
| Return on Equity [*net income / equity (total assets- liabilities)] | -0.004 | Ankara;11%, Morocco; -1%, Manila; 7% |
| Current Ratio (current assets / current liabilities) | 9.5 | Ankara; 1, Morocco; 0.8, Manila; 1.7 |
| Accounts Receivable / Collection Period (end of year accounts rec. / operating revenues x 12 ) | 1.7 month | Ankara; 5, Brussels; 1.2, Manila; 6 months |
To consider the profitability of the JWU operations; the return on equity has been calculated. It is about minus 0.004 of the total owner equity, however, this ratio is very close to zero, but it is acceptable for a non-profit organization. The ratio between current assets and current liabilities in JWU is about 9.5, while more than 75% of water utilities that have been included in the Transport Water and Urban Water and Sanitation (TWUWS) report, 1993 have a current ratio of less than one, which means that the current assets is higher than it should be, while the amount of the accounts receivable is acceptable at JWU as indicated by collection ratio. The collection of revenue takes on an average of 1.7 months, while 59% of the total water utilities worldwide have a collection period of two months and above as indicated by TWUWS Report, 1993.
The operational revenues of JWU range between 7 to 8 $ million a year. The total revenues are generated from four major sources as followed:
Concerning the water sales items, the JWU has been supplying and distributing water to subscribers at a specified tariff which is subject to change based upon the changes in costs. Price changes are proposed by the JWU for approval by the Officer in Charge of Water Affairs of the Occupation Authority . JWU currently implements a progressive tariff with the unit price increasing according to the consumption of water. Table 19 represents types of subscribers based on the tariff applied, ratios of consumption and revenues. The existing tariff (1995) is divided into four categories:
Consumers are billed every two months.
Table 19 Types of Subscribers based on Tariff applied, Ratios
of Consumption and Revenue as in 1994
| Types of Subscribers | Consumption m3 | |||
|---|---|---|---|---|
| Below 10 m3 | * 309460 | | | |
| From 10 to 20 m3 | 1897822 | | | |
| From 21 to 40 m3 | | |||
| From 41 to above m3 | 1485410 | |||
| Bulk Customers | 1243085 | | | |
| Average Tariff Applied per m3/1994 | | |||
| Meter Rental per m3 | | |||
| Total Tariff Applied per m3 | | |||
| *129179 m3 is the actual amount consumed below 10 m3 |
As indicated by the above figure the tariff employed varies and ranges between $ 0.91 per m3 to $1.32 per m3. The way the tariff is stated encourwater conservation by increasing the rate for high consumption. This leads to having different ratios of consumption and returns as shown by Table 19. The distribution of consumption in the tariff categories indicates that third category actually subsidize others.
FINANCIAL ACCOUNTING SYSTEM
The present accounting system does not include a cost system or
relevant classifications to serve establishing a relevant cost
system. JWU entries and financial records are made according to
the double entry method rather than the single entry method used
by other water institutions in the West Bank. To verify costs
at each stage of water production and distribution, expenditures
are entered under different heads, namely: pumping, supply lines,
meters, stores, transport and administration.
A chartered accountant audits JWU accounts and prepares its annual
balance sheet at the end of each fiscal year.
Water Cost
Table 20 shows average cost and expenses per m3 based on supplied or sold water.
Table 20 Summary of Total Cost and Cost per m3 of the JWU Operations (1992-1994)
| Cost and Expenses | 1992 Total US $ | 1993 Total US $ | 1994 Total US $ | m3 Sold |
|---|---|---|---|---|
| Production Costs | 1,281,792.98 | 1,284,233.35 | 1,414,209.00 | $ 0.25 |
| Water Purchases | 2,820,579.93 | 2,957,335.66 | 3,393,316.00 | $ 0.59 |
| Pumping of Purchased Water | 171,958.18 | 175,778.24 | 303,941.00 | $ 0.05 |
| Selling & Distribution Expenses | 1,782,810.18 | 1,648,573.91 | 1,773,123.00 | $ 0.31 |
| Administration and Financial Expenses | 703,204.78 | 992,368.48 | 599,105.00 | $ 0.11 |
| Total Costs | 6,760,346.05 | 7,058,289.64 | 7,483,696.00 | $ 1.31 |
| Revenues of Connections & Others | 494,080.23 | 494,080.23 | $- 0.09 | |
| Average Cost per m3 Sold Water | $=1.22 | |||
| Average Cost per m3 Water Supply | | | $ 0.93 | |
| Average Cost per m3 UFW | $ 0.29 | |||
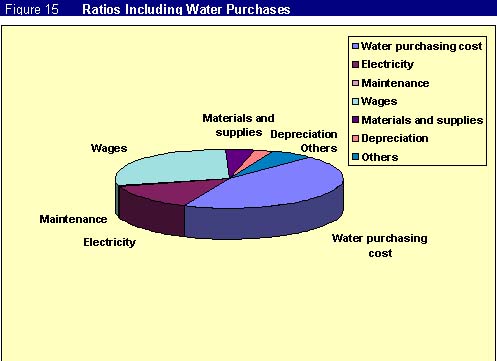
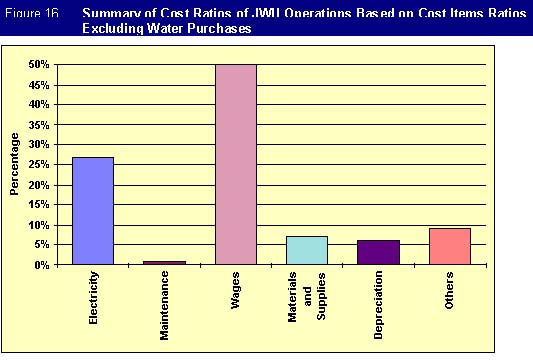
The following table and charts show the different ratios of operation costs.
Table 21 Summary of Cost Ratios of JWU Operations
Based on Cost Items
| Operation Cost Items | Item Ratios Including Water Purchases | Item Ratios Excluding Water Purchases |
|---|---|---|
| Water purchasing Cost | | |
| Electricity | | |
| Maintenance | | |
| Wages | | |
| Materials and supplies | | |
| Depreciation | | |
| Others | | |
Plans for Cost Reduction:
JWU started a comprehensive analytical process to its costs componants in order to reduce the cost per m3 of water supplied to consumers. The implementation and utilization of the appropriate technology will lead to the reduction in labor cost, and preventive maintenance and rehabilitation programs for networks also decrease the operation cost.
The Following table shows the ratios of the expected cost reduction and its effect on water cost per m3:
Table 22 Summary of the Expected Reductions on the Average
Water Cost per m3 ( Based on Figures from 1994 )
| Details | cost per m3 | % |
|---|---|---|
| Present operation cost per m3 water
Reductions of cost as a result of: | $ 1.22 | 100% |
| Replacing of Water purchasing by internal production | $ 0.15 | 12% |
| Rehabilitation of 20% of water network, and other savings in the water meter operations | $ 0.13 | 11% |
| Automating the monitoring system in pumping stations | $ 0.01 | 8% |
| Expected average cost per m3 water | $ 0.93 | 31% |
Table 23 Distribution of Cost and Expenses of JWU Operations
as in 1994 Based on Function Centers
| Items | Cost Center Ratios Including Water Purchasing | Cost Center Ratios Excluding Water Purchasing |
|---|---|---|
| Production Cost | | |
| Pumping Cost | | |
| Purchasing Cost | | |
| Distribution Cost and Meters Expenses | ||
| Administration and Finance Expenses | | |
| Total | | |
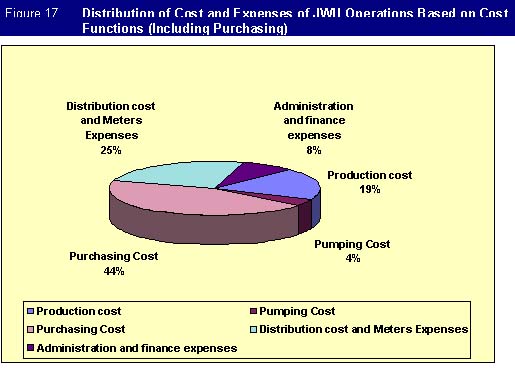
Table 24 Balance Sheet as of December 31/1994
| ASSETS | AMOUNT | TOTAL | ||
|---|---|---|---|---|
| USD | Cent | USD | Cent | |
| FIXED ASSETS: | ||||
| Network , Pumping Stations ,Vehicles | ||||
| Land Building ,Computer | 4924957 | 02 | ||
| Less: | ||||
| Accumulated Depreciation | 1657821 | 16 | ||
| Net Fixed Assets | 3267135 | 86 | ||
| CURRENT ASSETS: | ||||
| Cash | 360759 | 29 | ||
| Bank Accounts | 600350 | 59 | ||
| Accounts receivable (Consumers) | 1092990 | 83 | ||
| General accounts receivable | 476573 | 43 | ||
| Deposits | 27 | |||
| Projects in Process | 130792 | 50 | ||
| End of year Inventory | 501548 | 22 | ||
| Total Current Assets | 3163015 | 13 | ||
| MISCELLANEOUS: | ||||
| Accumulated deficits / previous Years | 674828 | 11 | ||
| plus: Net deficit 1994 | 345535 | 30 | ||
| Net Miscellaneous Balance | 1020363 | 41 | ||
| TOTAL ASSETS | 7450514 | 40 | ||
| LIABILITIES | AMOUNT | TOTAL | ||
|---|---|---|---|---|
| USD | Cent | USD | Cent | |
| FIXED LIABILITIES: | ||||
| Consumers Deposits | 225 | 65 | ||
| Loans | 125 | 20 | ||
| Provisions for assets replacement | 2104164 | 46 | ||
| Reinvestment Provision Fund | 574219 | 98 | ||
| Emergency Provisions | 2578474 | 33 | ||
| Loans interest Provision | 238713 | 61 | ||
| Employees Compensation Provisions | 1621404 | 32 | ||
| Total Fixed Liabilities | 7117327 | 55 | ||
| CURRENT LIABILITIES: | ||||
| Cairo Amman Bank | 130273 | 67 | ||
| Hapolim Bank | 197444 | 30 | ||
| Tenders Performance Deposits | 2321 | 62 | ||
| un-cashed checks | 3147 | 26 | ||
| Total Current Liabilities | 333186 | 85 | ||
| TOTAL LIABILITIES | 7450514 | 40 | ||
Table 25 Surplus and Deficit Statement as of December 31/ 1994
| DETAILS | AMOUNT | TOTAL | ||
|---|---|---|---|---|
| USD | Cent | USD | Cent | |
| Sales and Distribution Cyclic | -445809 | 62 | ||
| Revenues in 1994: | ||||
| Estimation Fees | 12566 | 66 | ||
| Reconnection Fees | 9040 | 00 | ||
| New connections | 687357 | 55 | ||
| Interest on Accounts Receivable | 173000 | 54 | ||
| Miscellaneous Returns | 60027 | 43 | ||
| Additional charges to Consumers | 10011 | 72 | ||
| Insurance Refunds | 10846 | 00 | ||
| Reparing Breakages | 26737 | 15 | ||
| Bank Interest | 80277 | 50 | ||
| Sub Total | 1069864 | 55 | ||
| Net Revenues | 624054 | 93 | ||
| Less: | ||||
| Administrative Expenses | 599105 | 69 | ||
| Discounts | 36351 | 32 | ||
| Works Refund Fees | 13746 | 11 | ||
| Total | 649203 | 12 | ||
| Plus amortization of grants(reinvestment recovery fund ) | 320387 | 13 | 969590 | 25 |
| Net Deficit | -345535 | 32 | ||
Due to the prevailing social and political conditions in the area, and the inefficiency of the postal and banking services, JWU was compelled to distribute its bills directly to the consumers by hand. This method, entails extra effort and cost to JWU that could otherwise be saved. The following table and chart show how the consumers paid their drinking water bills to JWU during 1990 and 1994:
Table 26 Methods of Payments
| Method Of Payment | 1990 % | 1994 % |
|---|---|---|
| Through the Banks | | |
| At JWU Headquarters | | |
| To the Collectors who Visited Consumers' Houses | ||
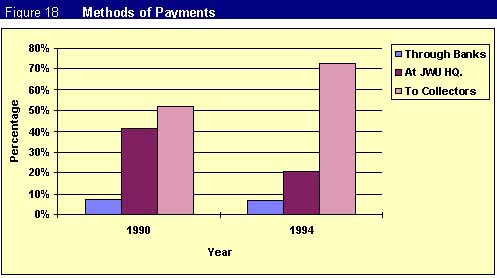
Collection rate at JWU in 1994 is about 88% which is an excellent collection rate in any standards. Very little if any pressure is put on the consumers to pay their water bills especially in the last few years due to the political and social hardship that faced them. However, as stated earlier, the consumers showed an excellent sense of cooperation and patronage by continuing to pay their bills on time. A noticeable change is evident in the trend of consumers payments i.e. in 1990, 41% of the payments were made at JWU Head Office and 52% were paid to the JWU collectors visiting the homes. In 1994 only 20.5% of the payments were made at JWU Offices and 73% paid to the collectors. This change is due to the frequent, strikes, curfews and closures of the areas by the Israeli Military.
1. Full Cost Recovery: Despite of the deficiencies of certain years, it can be said that the Undertaking achieved cost recovery. Theoretically, the value of assets in balance sheet does not show the real value due to world inflation and the constant devaluation of Israeli Currency. The revaluation of the assets should be done by the help of experts, the value of assets should be adjusted when necessary in order to have the right depreciation value which will lead to full cost recovery achievement.
2. Periodical Budgets: Divisions will be required to work within pre-established budgets based upon the level of sales and production expected that year or period. Cost control procedures will be implemented, division managers held accountable for over-budget expenses, budgeting the cost can be achieved, thus leading to a sound water pricing policy.
3. Find more profitable and secure methods to reinvest the Undertaking revolving f.
4. Revaluation of the Undertaking's assets: In order to get the real depreciation value and true cost of water, the assets of JWU should be reevaluated by experts in the field.

