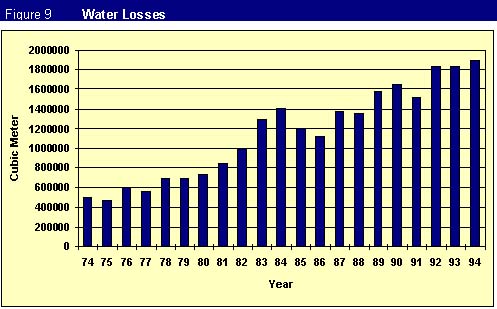
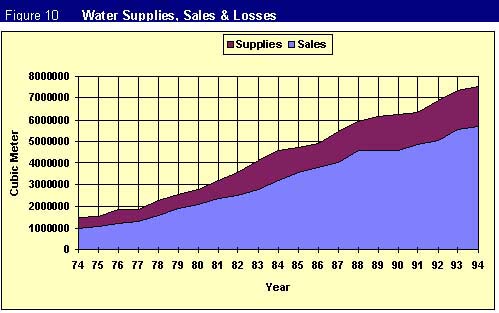
Many factors determine the quantity and percentage of UFW. These differ from one network to another or even in the same network. The following tables show the water losses over the years 1991-1994 and illustrate the reasons, percentages and the cost of UFW at JWU as recorded in 1994:
Table 11 Summary of Water Losses Quantities and Ratios of JWU
| Details | 1991 | 1992 | 1993 | 1994 | Average |
|---|---|---|---|---|---|
| Water Supplied (m3) | 6,356,890 | 6,883,885 | 7,372,422 | 7,555,811 | |
| Sold Water(m3) | 4,839,429 | 5,047,793 | 5,526,571 | 5,667,466 | |
| Water Losses (m3 | 1,518,961 | 1,835,392 | 1.834.551 | 1,888,345 | |
| Losses Ratio in JWU | 23.9% | 26.6% | 24.9% | 24.99% | 25.09% |
Table 12 Losses Breakdown
| Source of losses | Qty. Cu. Meter | Percentage | Value in USD | |
|---|---|---|---|---|
| 1 | Damage to main pipe lines | 7176 | 0.38% | 8754.00 |
| 2 | Damage to distribution network | 958146 | 50.74% | 1,168,938.00 |
| 3 | Inaccuracy of meter recording | 810100 | 42.90% | 988,322.00 |
| 4 | Black losses | 109524 | 5.80% | 133,619.00 |
| 5 | Washing of new lines and reservoirs | 3399 | 0.18% | 4,147.00 |
| Total | 1,888,345 | 100.00% | 2,303,781.00 | |
These losses may be defined as the quantities of water lost in the main lines between water sources and the distribution network. These losses are caused by leaks or damages to the lines due to excessive water pressure, damage by external factors or corrosion. The percentage of this kind of loss is small because JWU started to replace old deteriorated lines with new 6", 10", and 16" diameter pipes. These pipes are installed below the ground surface at depths between 80 - 125 cm according to engineering specifications. Pressure is monitored in most of these lines through electronic control systems that signal the pumps when the pressure is nearing a dangerous level thus preventing the pipes from bursting.
LOSSES IN THE NETWORK
These losses constitute the quantity of water lost between the main supply lines and the consumers meters. These losses constitute the highest percentage of water losses and can be credited to the deterioration and aging of the pipelines which do not conform to standards and have been laid either exposed or more than two meters below ground surface. Water losses in the network can be detected and traced by many methods, some of which are the following:
LOSSES IN METERS
Water losses in meters can be defined as the quantity of water that is consumed by consumers but not recorded by the meters. The reasons for these losses may be credited to the following:
BLACK LOSSES
The illegal consumption of water has increased in the last few years due to lack of law enforcement and to the hard economical and social circumstances in the area. JWU is combating this trend by raising the awareness of the consumers and by increasing inspection and imposing penalties on the violators.
WATER LOSSES DETECTION
A simple method is used by JWU to detect the exact quantity of water losses in private meters. Main standard meters were installed on different main lines supplying certain sectors of consumers. By comparing the consumption recorded by private meters with that on the main meter, it appeared that the recorded quantities of water flowing through private meters were on the average 11.3% less than the quantities of water flowing through the main standard meters. This difference shows the actual water losses which private meters fail to record.
FUTURE PLANS IN THE METER SECTION
Customer Relations Unit
This is perhaps one of the most important developments required in the organizational structure of JWU. Constant interruptions by subscribers with complaints and other requests plague many employees. In addition, conflicting answers to the subscribers questions do not give a good image of JWU's organization. The Customer Relations Unit should deal directly with all customer complaints and requests and follow the necessary procedures to execute the requests and answer their questions without requiring the customer to speak with any other individual at JWU except in extreme cases.
Monitoring of Consumer Consumption for Irregularities
Since consumer consumption is already entered into the computer for billing purposes, this information should be used to monitor consumption and automatically report on irregularities. Limits should be set as 'normal' consumption (say, plus or minus 20% of the average consumption of the specific consumer) and allowances made for seasonal changes (an increase in the expected consumption in summer). Any consumption outside these limits should be checked. The responsibility for this activity should be assigned to the Customer Services Division (Meters).
Incentives for Collectors
In order to decrease the number of unpaid bills and control the time the meter bill collectors spend in the field, incentives on bill collecting should be implemented. Bill collectors should be given a bonus based on number of bills and amounts collected.
Installation of Main Water Meters
The Undertaking prepared a project to install main water meters at the entrances of villages and distribution localities in order to compare the reading from these meters with the collective reading of all the meters in each village or locality. This action, will determine the amount of water losses and possibly its location.
Installation of Water Meter Test Bench
The Undertaking recognizes the need for improving the efficiency of its water meters, hence it introduced a project to purchase a new improved water meter test bench. This test bench has the capability to test 50 meters at one time which will make it feasible and possible for the Undertaking to test a much larger number of consumer meters in order to maintain the efficiency and accuracy of these meters.
Data Terminals for Meter Readers and Collectors
This will increase the number of meters read daily ( currently 85 meters per reader per day) by 70%-100% . Additionally, the readings gathered by the readers will be entered into the computer system automatically.


